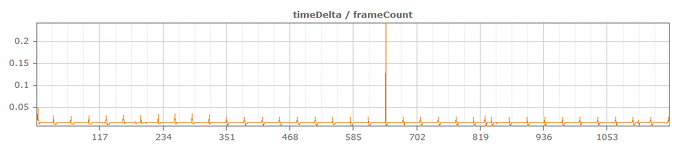
3 This article shows how to implement a simple graphical logging system to find errors in physics, AI and animation faster. Using graphs to debug physics, AI, and animation effectively9 Feb, 2011 in Development / Programming tagged graphical debugging / javascript / log / logging / regression testing / tools by Herman Tulleken
9 Text files can be messy when logging events from games. In this article, Herman Tulleken shows you how to use HTML, CSS and JavaScript to build visually informative logs that make debugging easier. Make your logs interactive and squash bugs faster25 Jan, 2011 in Development / Programming tagged css / debugging / html / javascript / log / logging / performance / testing / tools by Herman Tulleken
 3
3 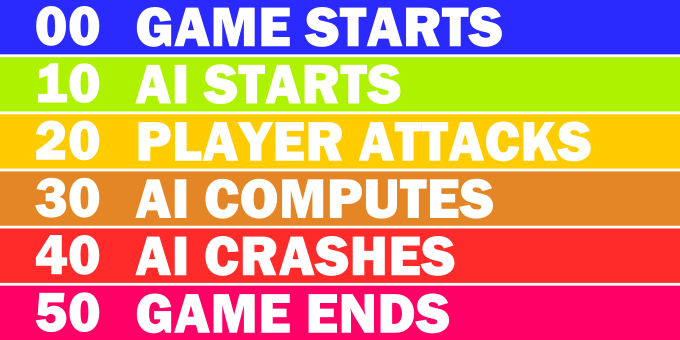 9
9