 Anyone who has stepped through code or has waded through endless lists of variables or log entries knows that these aren’t always the best ways to find certain kinds of bugs. For example, when a physics-controlled object does not behave as expected, looking at how the values of variables change on every frame can be a painfully slow and frustrating process – if you are lucky enough to be able to break into the debugger at the right time.
However, when you display the values of variables graphically, you can instantly see trends and relationships. This makes it much easier to spot errors and to track down what caused them. Sometimes it can even highlight problems that you were not aware of.

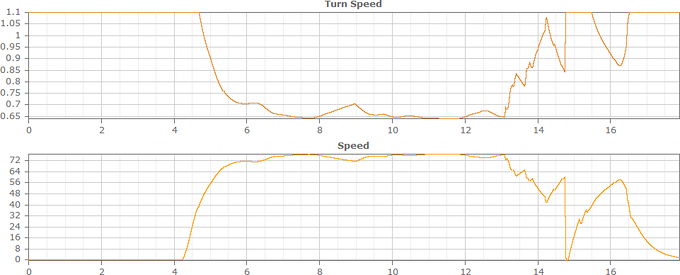
These graphs show two variables from a vehicle simulation. Notice how easy it is to see that the turn speed relates to the vehicle speed from the graphs. It is also immediately obvious that the turn speed is truncated at 1.1, and that it is not filtered.
Continuous event logs are logs that contain information that changes every frame. Compare this with discrete event logs that were discussed in a previous article. In this article, we only consider continuous event logs that are represented with graphs.
There are several ways to use graphs to show the values of variables. Here are just some of them:
- Write all the data to a tab-delimited text file, and use spreadsheet software to draw graphs. This is by far the simplest method, and it gives you access to the spreadsheet software’s analytical tools. It is also very easy to draw comparative graphs.
- Build a graph widget into your game engine, and display graphs on the screen while the game runs. This method is very powerful, because you can match events in the game with trends in the graph. However, it can be painful to implement, especially if your game engine does not readily support this kind of thing. Also, when you track the values of multiple variables, your screen can become quite messy – and there is only so much you can pay attention to at any one time. To compare the data with those of previous runs, you need to write the values to a file in any case.
- Write all the data to a file, and use JavaScript to render it in your browser. This method is a bit trickier to implement than using spreadsheet software, but it is much easier to implement than the in-game graph widget. Luckily, there are many free and open-source JavaScript libraries that will enable you to draw graphs directly in your browser. This method also has a workflow advantage over the spreadsheet method: run the game, and refresh your browser. That’s it. When you use a spreadsheet, you will have to import the data again and redraw the graphs.
I like the JavaScript option. It also works nicely with discrete-event logs, although they can be completely separate.
The implementation is straightforward:
Implement GraphicalLogger
- Add a GraphicalLogger class to your game that will use a data structure to store all the values of the variables that you want to track. The easiest data structure to use is a dictionary (or map in C++) that maps the name of each variable to a dynamic array (lists in C# and Java, vectors in C++). On every frame during a game run, the class will add the value of each variable to its corresponding dynamic array.
- Create a LogVariable function that takes as its input a variable name (as a string), the current time, and the variable’s value. The function should use the variable name to look up the corresponding dynamic array in the dictionary, and should then write the variable’s value to the array. Most of your data will be floating point numbers. However, if you use vectors (2D or 3D) or any other type of compound numerical data, ensure that these compound values can be also be retrieved together so that they can be plotted on the same graph.
- Add a switch that makes it possible to enable and disable logging. This should preferably be a something that you can set at compile time, so that you can exclude the logging system completely from your game if you need to.
- Create a DumpData function that writes the data to a file. To avoid having to use a parser, write the data directly in JavaScript syntax. I have used an array of arrays, but other data structures might work better for your purposes.
Create a JavaScript and an HTML file to display the graphs
- Traverse the data structure that your GraphicalLogger class wrote out, and draw a graph of each variable. For compound values, you could draw multiple graphs on the same set of axes. It is a good idea to scale the data to a uniform range so that your graphs are all the same size, which makes them easier to read and to compare.
- Use an external graph library, such as one of these:
(These are not as pretty as some of the others that you may find, but the pretty ones usually require a framework, such as jQuery, which might be overkill for a quick project.)
Using the Graphical Logger
To use the logger, call the set up code when your game starts, and the tear down code (including the DumpData function) when your game ends. (You may also choose to write out the data every now and again while the game is running, if this will help you to find the cause of a crash.) And then call the logging function in your main loop or Update event.
Make sure that you log each variable only once per frame. If you need more than one snapshot of a variable per frame, use a numbering scheme (myVariable_0, myVariable_1) or a scoping scheme (myVariable::beforeAI, myVariable::afterAI). A scoping scheme is more informative.
Alternatively, you can wangle the time stamps, so that the data points still appear in the right order and that no two points appear at the same time.
LogVariable(“myVariable”, currentTime + 0 * verySmallIncrement, myVariable)

... //do something with myVariable

LogVariable(“myVariable”, currentTime + 1 * verySmallIncrement, myVariable)

... //do something with myVariable

LogVariable(“myVariable”, currentTime + 2 * verySmallIncrement, myVariable)
This is a bit tricky to implement, and makes it harder to compare variables directly. In particular, you have to make sure that verySmallIncrement is small enough so that the times for the variables still fit in before the time of the next frame. A safe, but labour-intensive, way to implement this is to queue the events in memory, then to calculate the appropriate increment when you have the time stamp for the next frame, and then only to write the events to the log file.
Logging Boolean variables and states
Although continuous event logs are best suited to numerical data, you can easily map Boolean variables and states to integers that you can use to draw graphs. This can help you to detect flickering states, or to pick up states that do not change as they are supposed to, especially if they depend on numerical data.
For example, in a racing game, your AI vehicle might have, among others, a ‘driving’ state, and a ‘decelerating’ state. If there is code that limits the speed of the car by changing carefully between the states, the AI vehicle might flicker between the ‘driving’ and ‘decelerating’ when it is supposed to be driving at a specific speed. You will spot this easily on a graph of the vehicle’s states over time.
What to log
Continuous event logs are most useful for debugging glitches in physics, AI, animation, and other complicated systems that change over time. Typically, you will write out log entries to debug a specific issue, and then you will remove it once you’ve solved the problem. Because it is easy to forget a call to the logging system, it’s a good idea to display a warning message in the console the first time that the logging system writes something to the log.
You may also find it useful to log the values of a few important variables permanently, and to control these with a separate debug switch instead of removing them when they are not needed. This can serve as a crude sanity check when proper regression testing isn’t feasible. With time, you will learn to recognize the typical shapes of the graphs for these important variables. It will then be easy for you to spot deviations, spikes, or plateaus quickly.
Another good idea is to log the delta time, that is the time difference between successive frames. Spikes (especially recurring ones), unusual amounts of jitter, or plateaus at high delta time values could indicate performance problems. Plateaus at or frequent drops to zero could also indicate issues that can cause problems for physics and AI, especially in code that uses position, velocity, or acceleration to predict other values.
If you’re able to correlate these anomalies with other variables, you could come much closer to finding the cause.

Hmmm... a rogue garbage collection?
Performance
In a typical 3D game, the effect of the logger should be negligible. As long as you do not track too many variables at a time, memory should also not be a problem, even if you run the game for quite substantial stretches of time. If you find that memory does become a problem, you could easily stream the log to the disk.
For 2D and mobile games, the performance impact is much greater. It is better not to use continuous event logs a mobile device, but rather only in an emulator.
Links
- Another article on the topic, that gives in-game implementation tips: Monitoring Your Game.
Pingback: 50 Tips for Working with Unity (Best Practices) » devmag.org.za
Awesome article! I did something similar to debug first person spectator hitching for Natural Selection 2. Hitches show up very clearly when plotted out. I wanted to add that Python+MatPlotLib is another great way of viewing plot data. You can zoom, label lines, etc. etc. If you can afford it, MatLab is of course the gold standard for this kind of analysis.
Pingback: ??Unity3D?50????Unity3D???? « ??'s Blog